
Application Monitoring
These days there are a lot of different application monitoring solutions. I know cause I’m in the middle of looking through them for a good fit. The hardest thing for an IT operations engineer is having to be woken up at 3AM to fix a “Server Down” situation. However, it’s even more detrimental to for a company to have a customer or a critical application to be down and no one be alerted.
I always think about the old adage, “If a tree falls in the woods but no one hears it does it actually fall?” Well of course it does. The difference is no one knows or cares about said tree. Well if that tree is a tier 1 app. You better know whats going on.
I decided to write this cause I had a really hard time figuring out how to get things setup in vROPS. Yes disk monitoring and other basic management packs are available for vROPS, but I wanted to be able to do more. HTTP get requests, IIS, SQL, ETC.
I know this will probably all change with vROPS 8.0 coming out, but for now this is what I wanted to roll out to test. The process may change or it may stay the same. Once I get my dirty hands on it, I’ll update this post as needed.
Couple of Pre-Requisites
- vRealize Operations deployed into your environment
- Licensing for the Enterprise edition of vROPS. You can do some OS monitoring with Advanced, but for application monitoring, you will need Enterprise
Application Remote Collector
Here is a video by John Dias on what you need to do to set this up, I’ll go through it step by step as well, so you have some steps on top of the video.
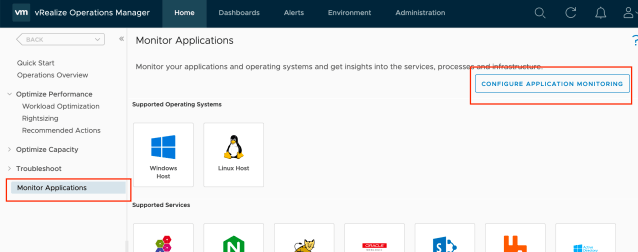
- Log into vROPS
- On the dashboard go to “Monitor Applications” and then select “Configure Application Monitoring”
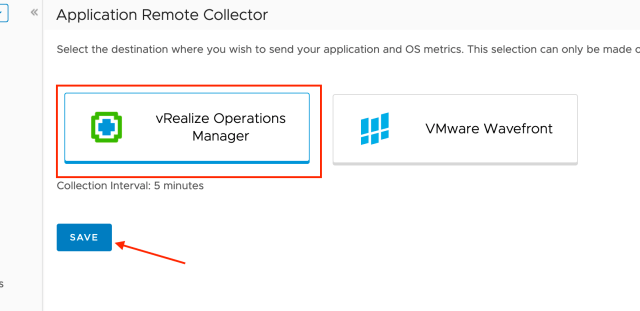
- Next you will Select what type of application Monitoring you will use. Either vROPS or Wavefront. For this we’ll use vRealize Operations, and Click “Save” NOTE: This is an irreversible choice. So plan ahead and make sure that you will be using this monitoring through vROPS only for the selection you pick.
- This can take a while, but if you haven’t activate the vRealize Application Management Package in vROPS you will be notified to do so.

- Just click “Activate” and it will take you to the Administration Tab:
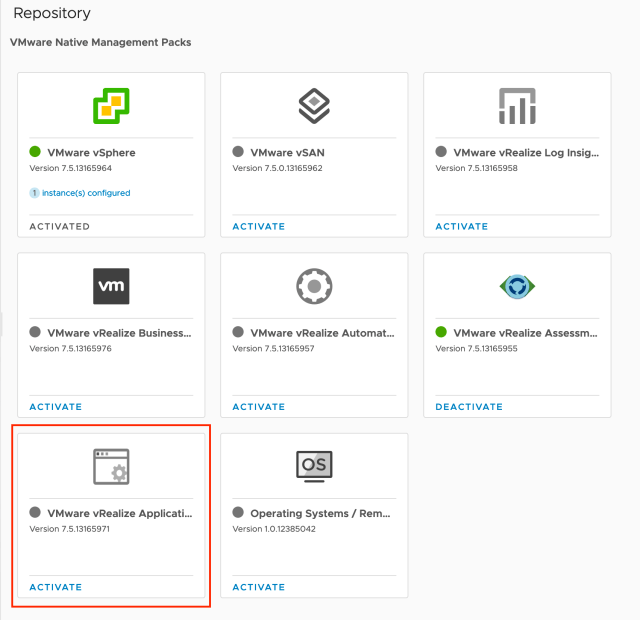
- Just click “Activate”, This will take some time depending on the size of your deployment.
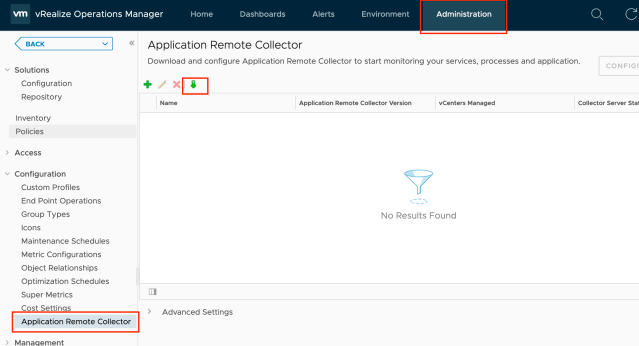
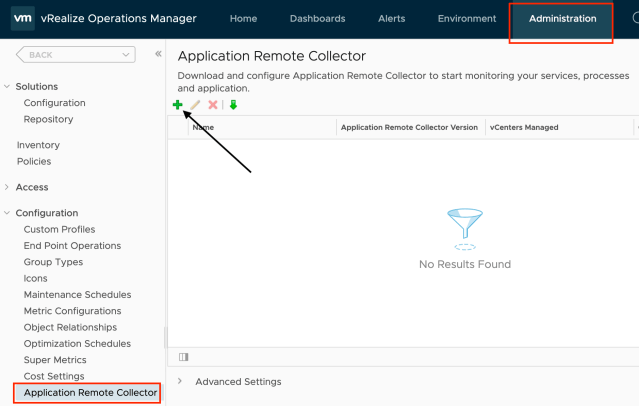
- Now that it’s activated, On the same tab(Administration) go to “Configuration”, and “Application Remote Collector”. Click the green download arrow to download the OVA of the Remote Collector. This will need to be deployed into your environment.
- Once the OVA is downloaded, deploy it to your environment. Probably good to neighbor your vRealize Operations deployment, so that you wont have to deal with those Networking guys. I wont go over the OVA deployment as it’s pretty standard. I will note, that you need to make SURE you remember the password you set.
- Power up your Remote collector appliance.
- Set a DNS record for the Remote Collector IP.
- Once the Collector is up. Open the console
- Login with username: root, Password: “vmware”
- Create a new password
- run: vi /etc/ntp.conf
- Add a new line at the bottom pointing to an NTP server – Line will look like: “server time.google.com”
- Run the following
- enable NTP
- systemctl start ntpd
- systemctl enable ntpd
- enable start ssh
- systemctl enable sshd
- systemctl start sshd
- enable NTP
- Return to vROPS and go to the “Administration” tab under “Configuration -> Application Remote Collector” Click the green “+”
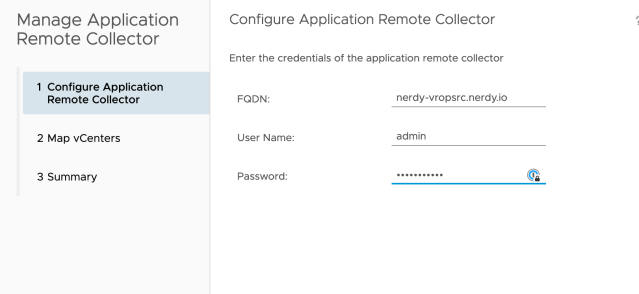
- Here is where DNS comes in. I’ve had some issues with getting vROPS to see the collector. On the top line input the FQDN of the collector(IP works as well for setup) input your Username and Password that you set when you created the appliance.
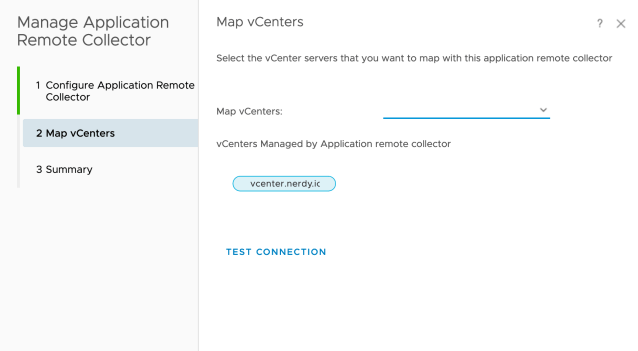
- Under “Map vCenters” Select the vCenter from the drop-down and run “Test Connection”.
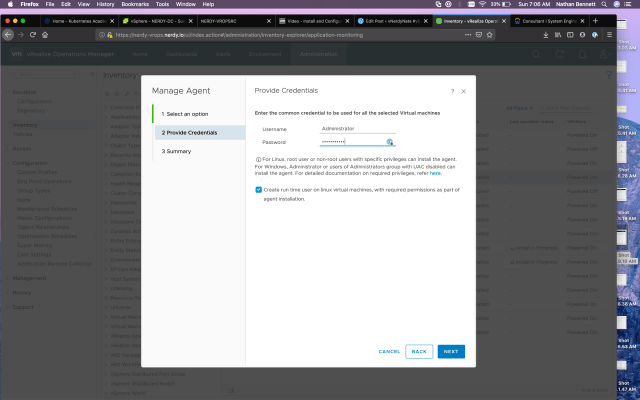
- Now after the Collector is loaded, click, “Configure Agents”. Select the VMs you want to install the agent on, and click the “Install” button (It’s the arrow pointing down). FunFact – You can use shift click to select multiple machines, and use the filter to allow a better selection.
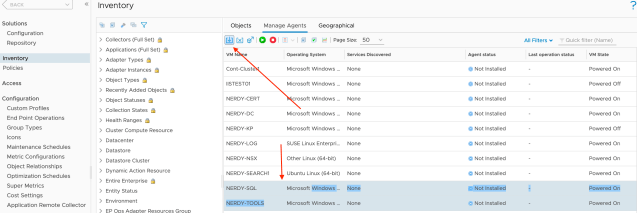
- I use a “Common Password” and a service account for my agent deployments.

- It’s not very intuitive, but once the agent has finished connecting and has some built in service, you can create a custom built monitoring solution off the “Manage Service” button. It has some built in ports etc.

- Now you can setup some other monitoring, For instance some port probes, HTTP probes, or a simple ICMP check to verify the machine is up. These all have some different configurations settings, but you can explore from here.
Now that you have configured an application collector and agents have been deployed, you can go to the “Troubleshoot Application” dashboard and take a look! Here is an example of an ICMP checker when the server is down. Notice availability? On the other ICMP check the availability shows 100 percent. Now you have a metric to track, as well as a map to see all the connections.
For the built in services, be sure to add a display name on it to track the service on the VM in “Troubleshooting an Application” in “Dashboards”. Here is an example of the domain controller. 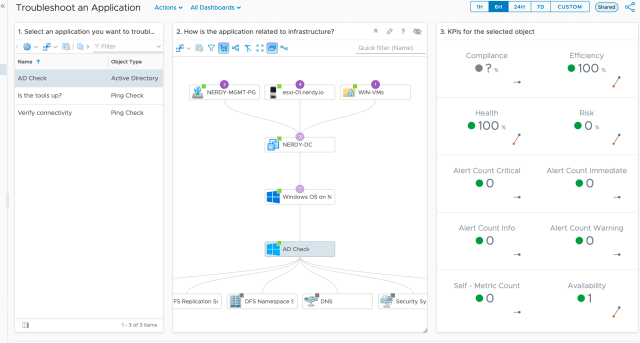
The Ad check is still collecting, at this point, but it shows the extensibility of the built in Monitoring Service.
I hope this helps get you started, I didn’t go very much over more than the video, but thats kinda the point. I really want to fill in spots that I had issues on, in case others have the same issues. Instead of calls over 3 days, I hope this is a good one stop config for the Applications collector on vRealize Operations 7.5
